Fast Food & Gaming Stock Correlation Study
CompletedAn analysis of how public health and cultural indicators relate to stock performance — and a case study in catching a spurious correlation.
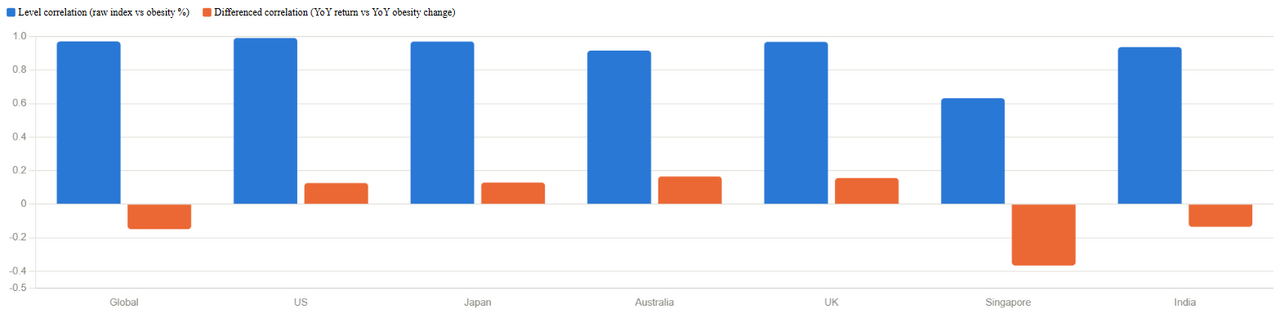
A Python-based research project testing whether population health metrics (obesity prevalence) show a measurable relationship with equity market performance, correlating 45 years of returns (1980–2024) across 65 individual restaurant and fast-food tickers against national obesity trends in six countries plus a global aggregate, using both Pearson and Spearman correlation. The headline numbers are also the trap here: obesity prevalence and the stock index level move almost in lockstep (r = 0.97 globally, up to r = 0.99 in the US) — but that's two series trending upward together over 45 years, not evidence either one drives the other. Switching to year-over-year changes — the actual test for a real relationship — collapses the correlation to a statistically insignificant r ≈ 0.13 (p > 0.4). The project deliberately reports both: the impressive-looking level correlation, and the honest year-over-year one that debunks it.